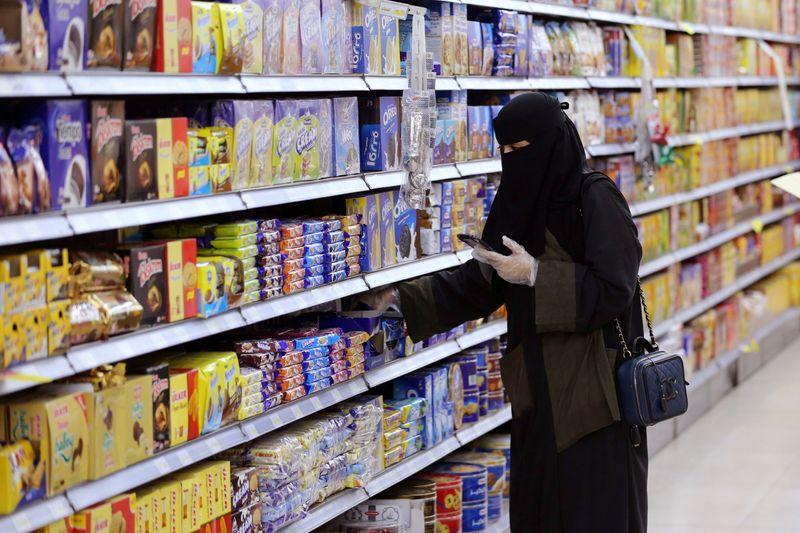
In November 2020, it is seen that Saudi Arabia’s consumer price index shows a very rapid increase by 5.8%. There must be many reason for this increase and it should be consider as good change and deviation compared with last month. It was same as the last to last month according to a research. Due to low oil prices it is seen that there are many changes in economies and delivery of mature food products. A steep economic contraction can be seen by the world’s largest oil exporter this year and it is not stopping. While coronavirus induced restrictions curbed global crude demand and heart domestic activities. Throughout the kingdom there is an increase in tax in July. It is granted that the increase in the value added tax from 5% to 15% is recorded in the particular month of 2020. It had a great influence on many things like increase production of goods in market etc. An overall influence on consumer prices result in the rise of CPI originated mainly from the increase in prices of food and beverages that is recorded as +13% and if you see the transport inclination it is +8% said by the general authority for statistics.
There are lots of things which are depending on consumer price index. For example let’s take a local vendor is setting a price of a product according to his need and on the other hand there is a government shops so both will have their own prizes. So in both the cases the consumer prices increases. In 1913, the federal government started compiling the consumer price index. It was tracked through different ways and especially it is in two ways. Monthly changes are recorded in price of goods and services through various technologies and through this record we can tell the feedbacks and at how much rate it is expanding. There are categories in CPI. There are 8 categories in consumer price index, which includes housing apparel, transportation facilities, food and beverages and some other goods and services. These are some important essentials which should be seen and these are the high priority things in which we need to see that how the price trends are going up and how they are going down.
Approximately 80000 goods and services are being analyzed every month in 87 cities to arrive at a weighted average for the nation. A display for both CPI-W and C-CPI-U shows the statistic display the weighted average in monthly. There is a method which is called Inflation/deflation in this practice we usually do comparison of prize and trends which are heading up the market. The statics was then compared to have a proper analyzed report and how these trends are fluctuating from one month to another and it was recorded for a particular period of time.


